Wen Hua Cai Jing
Search documents
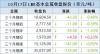
中国9月精炼铅进口量环比减少17.17% 分项数据一览
Wen Hua Cai Jing· 2025-10-20 10:30
Group 1 - The core point of the article highlights a significant decline in China's refined lead imports in September 2025, with a total of 1,507.92 tons, representing a month-on-month decrease of 17.17% and a year-on-year decrease of 94.69% [1] Group 2 - Kazakhstan is identified as the largest source of refined lead imports, with 1,008.92 tons imported in September 2025, showing a month-on-month increase of 40.27% but a year-on-year decrease of 72.85% [1] - The Philippines ranks as the second-largest source, with imports of 197.11 tons, reflecting a month-on-month decrease of 40.22% [1] - India saw a significant month-on-month increase of 91.35% in refined lead imports, totaling 196.23 tons, but experienced a year-on-year decline of 97.64% [1] - Other countries such as Mozambique and Thailand contributed smaller amounts, with Mozambique at 104.85 tons and Thailand at 0.81 tons [1]


宏观面偏暖 沪铜偏强运行【10月20日SHFE市场收盘评论】
Wen Hua Cai Jing· 2025-10-20 10:11
Core Viewpoint - Copper prices have shown resilience amid easing US-China trade tensions and stable economic performance in China, although domestic demand remains weak and social inventory continues to accumulate [1] Group 1: Market Performance - Copper opened slightly higher and continued to strengthen, closing up 0.73% [1] - As of October 20, domestic electrolytic copper inventory reached 195,500 tons, an increase of 12,400 tons compared to October 16 [1] Group 2: Supply and Demand Dynamics - Concerns about tight supply persist due to previous disruptions at the mining level, with domestic copper concentrate processing fees hovering around -40 USD/ton [1] - The increase in inventory is attributed to a significant inflow of imported copper and limited outflow from warehouses, as downstream consumption shows limited growth potential [1] Group 3: Future Outlook - Jin Yuan Futures suggests that the resumption of US-China negotiations may boost market risk appetite, with expectations of two interest rate cuts by the Federal Reserve this year [1] - Despite slightly lower-than-expected domestic consumption, the market remains in a tight balance, with supply growth from mines below 1% this year and limited growth in global smelting output [1] - The combination of easing macroeconomic disturbances and strong cost support is expected to lead to a short-term upward trend in copper prices [1]
中国9月氧化铝出口量环比增长36.71% 分项数据一览
Wen Hua Cai Jing· 2025-10-20 10:04
海关统计数据在线查询平台公布的数据显示,中国2025年9月氧化铝出口量为246,420.17吨,环比增加 36.71%,同比增加82.25%。 | 25.00 | | | | | --- | --- | --- | --- | | 瑞菲 | 24.03 | 3597.23% | | | 厄瓜多尔 | 22.03 | -- | -- | | 尼日利亚 | 20.47 | -84.78% | -26.90% | | 加拿大 | 17.54 | 192.32% | 305.71% | | 巴基斯坦 | 13.00 | -36.47% | -- | | 奥地利 | 12.00 | -- | -- | | 尼日尔 | 10.00 | -- | -- | | 委内瑞拉 | 6.00 | -- | -- | | 秘鲁 | 5.60 | -97.54% | -93.38% | | 危地马拉 | 5.00 | -- | -- | | 菲律宾 | 4.60 | -52.21% | -- | | 葡萄牙 | 4.05 | 32.79% | 26.56% | | 坦桑尼亚 | 4.00 | -85.71% | -73.86% | | ...

10月17日LME金属库存及注销仓单数据
Wen Hua Cai Jing· 2025-10-20 09:25
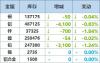
Group 1: Inventory Changes - Copper inventory decreased by 50 tons to 137,175 tons, with a registered warehouse stock of 129,350 tons and a cancellation ratio of 5.70% [1][3] - Aluminum inventory remained stable at 487,125 tons, with a registered warehouse stock of 405,650 tons and a cancellation ratio of 16.73% [1][5] - Zinc inventory decreased by 700 tons to 37,325 tons, with a registered warehouse stock of 24,425 tons and a cancellation ratio of 34.56% [1][9] - Tin inventory remained unchanged at 2,735 tons, with a registered warehouse stock of 2,555 tons and a cancellation ratio of 6.58% [1][11] - Nickel inventory decreased by 54 tons to 250,476 tons, with a registered warehouse stock of 244,356 tons and a cancellation ratio of 2.44% [1][13] Group 2: Warehouse Specific Changes - In Rotterdam, copper inventory decreased by 50 tons to 14,500 tons, with a cancellation ratio of 1.21% [3] - In Singapore, zinc inventory decreased by 700 tons to 35,875 tons, with a cancellation ratio of 35.89% [9] - In Hamburg, aluminum inventory remained stable at 3,075 tons, with a cancellation ratio of 0.00% [5] - In Kaohsiung, tin inventory remained stable at 40 tons, with a cancellation ratio of 0.00% [11]
海关总署:中国9月精炼铜进口量同比上升7.44% 分项数据一览
Wen Hua Cai Jing· 2025-10-20 06:08
Core Insights - China's refined copper imports in September 2025 reached 374,075.58 tons, reflecting a month-on-month increase of 21.76% and a year-on-year increase of 7.44% [1][2] Import Sources - The Democratic Republic of the Congo was the largest source of refined copper imports, supplying 126,834.67 tons, with a month-on-month increase of 0.42% and a year-on-year increase of 3.27% [1][2] - Russia ranked second, exporting 48,359.13 tons, showing a significant month-on-month increase of 91.76% and a year-on-year increase of 37.40% [1][2] - Other notable sources included Chile (31,683.05 tons, +45.99% MoM, +9.20% YoY) and Kazakhstan (21,580.77 tons, +30.77% MoM, -21.73% YoY) [1][2] Detailed Import Data - A comprehensive breakdown of refined copper imports by origin for September 2025 is provided, highlighting significant increases from countries like Myanmar (15,549.01 tons, +109.97% MoM, +244.32% YoY) and Australia (13,563.58 tons, +147.29% MoM, +41.91% YoY) [1][2] - Conversely, imports from Japan (13,358.24 tons, +59.22% MoM, -43.13% YoY) and Peru (6,633.35 tons, +577.82% MoM, -37.45% YoY) showed notable declines in year-on-year comparisons [1][2] Summary of Trends - The overall trend indicates a robust increase in refined copper imports, particularly from emerging markets, while traditional suppliers like Japan and Peru are experiencing declines [1][2][3]

海关总署:中国9月铜矿砂及其精矿进口量同比增加6.43% 分项数据一览
Wen Hua Cai Jing· 2025-10-20 06:02
Core Insights - In September 2025, China's imports of copper ore and concentrates totaled 2,586,873.52 tons, reflecting a month-on-month decrease of 6.24% but a year-on-year increase of 6.43% [1][2]. Import Sources - Chile remains the largest source of copper ore and concentrates for China, with imports of 649,354.73 tons in September 2025, showing a significant month-on-month decline of 32.26% and a year-on-year decrease of 15.46% [1]. - Peru is the second-largest source, with imports of 590,254.26 tons, which represents a month-on-month increase of 4.64% and a year-on-year growth of 22.91% [1]. - Other notable sources include: - Indonesia: 155,930.64 tons, up 89.92% month-on-month and 68.11% year-on-year [1]. - Mongolia: 184,322.32 tons, up 1.40% month-on-month and 29.85% year-on-year [1]. - Russia: 96,537.04 tons, down 14.97% month-on-month but up 172.88% year-on-year [1]. Detailed Import Data - A comprehensive breakdown of imports by origin shows varied performance across different countries, with some experiencing significant increases while others faced declines [1][2]. - For instance, imports from Laos surged by 169.11% month-on-month and 174.83% year-on-year, while imports from Canada dropped by 19.56% month-on-month but increased by 131.30% year-on-year [1]. Summary of Trends - The overall trend indicates a mixed performance in copper ore imports, with certain countries like Peru and Indonesia showing growth, while Chile, the largest supplier, is experiencing declines [1][2].

统计局:9月中国十种有色金属产量为695万吨 同比增长2.9%
Wen Hua Cai Jing· 2025-10-20 06:02
Core Insights - China's primary aluminum (electrolytic aluminum) production in September 2025 reached 3.81 million tons, reflecting a year-on-year increase of 1.8% [1] - Cumulative production from January to September 2025 totaled 33.97 million tons, showing a year-on-year growth of 2.2% [1] - In September 2025, the production of ten non-ferrous metals in China was 6.95 million tons, marking a year-on-year increase of 2.9% [1] - The cumulative production of these ten non-ferrous metals from January to September 2025 was 61.25 million tons, with a year-on-year growth of 3.0% [1]
伦铜库存降至两个半月新低 沪铜库存小幅累积
Wen Hua Cai Jing· 2025-10-20 05:55
Group 1 - LME reported a decrease in copper inventory to 137,225 tons, marking a two-and-a-half-month low [2] - SHFE indicated a slight increase in copper inventory by 0.5% to 110,240 tons, reaching a five-and-a-half-month high [2] - International copper inventory rose by 5,358 tons to 17,031 tons [2] Group 2 - COMEX copper inventory reached 345,581 tons, the highest level since May 2003 [5] - The trend of declining inventories in domestic and international exchanges generally supports copper prices, while increasing inventories may exert downward pressure [2]

海关:中国9月铝矿砂及其精矿进口量为1588万吨 同比增加38.3%
Wen Hua Cai Jing· 2025-10-20 02:16
Core Insights - China's imports of aluminum ore and its concentrates reached 15.88 million tons in September 2025, marking a year-on-year increase of 38.3% [1] - From January to September 2025, the total imports of aluminum ore and its concentrates amounted to 15.73 million tons, reflecting a 32% increase compared to the same period last year [1] - In September 2025, China's alumina exports were recorded at 250,000 tons, which is an 82.2% increase year-on-year [1] - The total alumina exports from January to September 2025 reached 2 million tons, showing a significant year-on-year increase of 61.8% [1] Import Data Summary - Aluminum ore and concentrates: - September 2025: 1.588 million tons, 792.44 million RMB - January to September 2025: 15.731 million tons, 9.167 billion RMB - Year-on-year change: 38.3% (monthly), 32% (cumulative) [1] - Copper ore and concentrates: - September 2025: 259,000 tons, 5.215 billion RMB - January to September 2025: 2.263 million tons, 43.069 billion RMB - Year-on-year change: 6.4% (monthly), 19.9% (cumulative) [1] Export Data Summary - Alumina: - September 2025: 25,000 tons, 85.244 million RMB - January to September 2025: 200,000 tons, 753.867 million RMB - Year-on-year change: 82.2% (monthly), 61.8% (cumulative) [1] - Rare earths and their products: - September 2025: 10,538 tons, 256.961 million RMB - January to September 2025: 95,875 tons, 1.719 billion RMB - Year-on-year change: 7.6% (monthly), 3.1% (cumulative) [1]

金属普涨,期铜盘中触及一周低点,受美国信贷担忧拖累【10月17日LME收盘】
Wen Hua Cai Jing· 2025-10-18 00:55
Core Viewpoint - The London Metal Exchange (LME) saw most base metals decline, with copper hitting a one-week low, influenced by concerns over credit pressures in U.S. regional banks, leading to a negative sentiment in the market [1][4]. Group 1: Market Performance - On October 17, LME three-month copper fell by $42.5, or 0.4%, closing at $10,604.5 per ton, with an intraday low of $10,430, marking a 2% drop and the lowest since October 10 [1][2]. - Other base metals also experienced declines, with three-month aluminum down by $11.00 (0.39%), zinc down by $39.50 (1.33%), and tin down by $735.00 (2.05%) [2]. Group 2: Economic Indicators - Copper is viewed as a barometer for the global economy, with recent supply concerns pushing prices to a 16-month high of $11,000 per ton last week [1]. - Recent reports indicate a temporary easing of supply concerns, as copper inventories at the Shanghai Futures Exchange increased by 550 tons, reaching the highest level since April [4]. Group 3: Market Sentiment - The environment is characterized by a general risk aversion, with high-risk assets under pressure due to concerns over the U.S. economic situation [4]. - The spread between spot copper contracts and three-month forward contracts widened, indicating a decrease in immediate demand for copper [4].