LU
Search documents
Where is Mondelez International (MDLZ) Headed?
Yahoo Finance· 2026-02-22 12:22
Mondelez International, Inc. (NASDAQ:MDLZ) is one of the best sugar stocks to buy according to hedge funds. Mondelez International, Inc. (NASDAQ:MDLZ) announced on February 17 that it would highlight its commitment to long-term value creation at the 2026 Consumer Analyst Group of New York (CAGNY) Conference, supported by its portfolio of snack brands. It further stated that Mondelēz International will reaffirm its long-term growth algorithm of 3% to 5% organic net revenue growth, high-single-digit adjusted ...
燃料油早报-20260212
Yong An Qi Huo· 2026-02-12 02:39
Report Summary 1. Report Industry Investment Rating No information provided. 2. Core Viewpoints - This week, the near - month spread of Singapore 380cst decreased, the crack spread fluctuated downward, the Singapore residue inventory increased significantly, and the internal - external spread of FU weakened. The low - sulfur crack spread fluctuated, the spread was in a low - level oscillation, and the basis weakened. In terms of inventory, Singapore fuel oil inventory increased significantly, EIA residue inventory increased slightly, ARA residue inventory decreased, and Fujeirah inventory decreased. Under the new situation in Venezuela, heavy oil logistics is tilted towards the United States, Canadian heavy oil is seeking new buyers. Recently, there has been concentrated arrival in the Singapore high - sulfur market, the EW spread weakened, the Iranian situation affects heavy oil valuation, the internal - external spread of FU is short - term bearish, and the low - sulfur external market maintains weak operation [6][7]. 3. Summary by Relevant Catalogs Rotterdam Fuel Oil Data - From February 5th to 11th, 2026, the price of Rotterdam 3.5% HSF O swap M1 increased from 365.13 to 378.65, a change of 3.36; the price of Rotterdam 0.5% VLS FO swap M1 increased from 411.49 to 425.33, a change of 5.15; the Rotterdam HSFO - Brent M1 decreased from - 9.29 to - 9.40, a change of - 0.40; the Rotterdam 10ppm Gasoil swap M1 increased from 658.02 to 663.59, a change of 6.27; the Rotterdam VLSFO - Gasoil M1 decreased from - 246.53 to - 238.26, a change of - 1.12; the LGO - Brent M1 remained unchanged at 21.50; the Rotterdam VLSFO - HSFO M1 increased from 46.36 to 46.68, a change of 1.79 [4]. Singapore Fuel Oil Data - **Swap Data**: From February 5th to 11th, 2026, the price of Singapore 380cst M1 increased from 401.23 to 408.21, a change of 4.24; the price of Singapore 180cst M1 increased from 403.90 to 413.90, a change of 3.93; the price of Singapore VLSFO M1 increased from 462.92 to 467.23, a change of 5.15; the price of Singapore Gasoil M1 increased from 87.10 to 87.55, a change of 0.34; the Singapore 380cst - Brent M1 increased from - 4.43 to - 3.64, a change of 0.99; the Singapore VLSFO - Gasoil M1 increased from - 181.62 to - 180.64, a change of 2.63 [4][12]. - **Spot Data**: From February 5th to 11th, 2026, the FOB 380cst price increased from 425.18 to 431.06, a change of 5.89; the FOB VLSFO price increased from 461.76 to 467.37, a change of 6.42; the 380 - basis decreased from 12.25 to 14.05, a change of - 0.05; the high - sulfur internal - external spread increased from 14.8 to 12.4, a change of 0.4; the low - sulfur internal - external spread increased from 18.6 to 21.0, a change of 2.5 [5]. Domestic FU Data - From February 5th to 11th, 2026, the price of FU 01 increased from 2626 to 2648, a change of 2; the price of FU 05 increased from 2804 to 2860, a change of 15; the price of FU 09 increased from 2710 to 2751, a change of 10; the FU 01 - 05 spread decreased from - 178 to - 212, a change of - 13; the FU 05 - 09 spread increased from 94 to 109, a change of 5; the FU 09 - 01 spread increased from 84 to 103, a change of 8 [5]. Domestic LU Data - From February 5th to 11th, 2026, the price of LU 01 increased from 3261 to 3302, a change of 17; the price of LU 05 increased from 3281 to 3351, a change of 49; the price of LU 09 increased from 3270 to 3312, a change of 34; the LU 01 - 05 spread decreased from - 20 to - 49, a change of - 32; the LU 05 - 09 spread increased from 11 to 39, a change of 15; the LU 09 - 01 spread increased from 9 to 10, a change of 17 [6].
商品日报(2月9日):贵金属强势反弹 铂涨超10%沪银涨超8%
Xin Hua Cai Jing· 2026-02-09 11:33
Group 1: Commodity Market Overview - On February 9, the domestic commodity futures market showed mixed results, with platinum rising over 10%, silver over 8%, and palladium over 7% [1][2]. - The China Securities Commodity Futures Price Index closed at 1664.20 points, up 34.86 points or 2.14% from the previous trading day [1]. - The overall commodity index also increased by 48.07 points, closing at 2294.88 points, reflecting a similar 2.14% rise [1]. Group 2: Precious Metals Performance - Precious metals experienced a strong rebound, led by platinum's increase of 10.58%, silver's rise of 8.90%, and palladium's gain of 7.59% [2]. - Factors contributing to this rally include a weaker US dollar, increased buying interest, and China's central bank's gold purchases in January, which totaled 40,000 ounces, exceeding the previous month's 30,000 ounces [2]. - Despite positive consumer confidence in the US, the dollar index was not significantly boosted, and expectations of potential interest rate cuts by the Federal Reserve supported bullish sentiment in the precious metals market [2]. Group 3: Industrial Metals Insights - Industrial metals also saw gains, with lithium carbonate rising over 3% due to ongoing inventory depletion [3]. - The price of lithium carbonate briefly surpassed 140,000 yuan per ton, supported by a tight supply-demand balance despite lower production during the Chinese New Year [3]. - Data showed that lithium carbonate weekly production was 20,744 tons, down 825 tons week-on-week, while social inventory decreased by 2,019 tons, reinforcing the expectation of sustained demand [3]. Group 4: Specific Commodity Trends - Styrene experienced a significant drop of nearly 3%, attributed to weakening cost support from oil prices and declining demand as the Chinese New Year approached [4]. - The market anticipates an increase in styrene supply due to returning maintenance schedules, while downstream demand is expected to decrease during the holiday [4]. - For silicon and manganese silicon, both commodities fell over 1%, with current low iron water production limiting upward price potential [5]. Group 5: Market Sentiment and Future Outlook - The overall market sentiment remains cautious due to uncertainties surrounding upcoming US economic data releases, which may impact precious metals [2]. - The lithium carbonate market is expected to face short-term limitations on price rebounds due to macroeconomic influences and slowing transaction volumes as the holiday approaches [3]. - The outlook for silicon and manganese silicon prices will depend on the balance between supply excess and demand resilience in the steel sector [5].


商品日报(2月2日):商品市场普遍下跌 贵金属、有色金属及原油等大面积跌停
Xin Hua Cai Jing· 2026-02-02 11:57
Group 1 - The domestic commodity futures market experienced a significant downturn on February 2, with nearly all contracts closing lower, including major contracts for silver, palladium, platinum, lithium carbonate, nickel, tin, copper, aluminum, and various oil products [1][2] - The China Securities Commodity Futures Price Index closed at 1681.20 points, down 154.37 points or 8.41% from the previous trading day, while the China Securities Commodity Futures Index fell to 2318.32 points, a decrease of 212.88 points or 8.41% [1] - The sharp decline in precious metals was attributed to a shift in market sentiment, influenced by the nomination of Kevin Warsh as the next Federal Reserve Chairman and higher-than-expected core PPI data, which reinforced expectations for a hawkish monetary policy [2][3] Group 2 - The easing geopolitical tensions, particularly regarding U.S.-Iran relations, contributed to a decline in market fears of supply disruptions, further pressuring oil prices as U.S. crude inventories increased [4] - Industrial metals also saw widespread declines, with contracts for lithium carbonate, nickel, tin, aluminum, copper, stainless steel, and aluminum alloy all hitting their daily limits [5] - In contrast, caustic soda futures rose over 2%, driven by cost support from falling liquid chlorine prices, although high inventory levels and weak demand continue to pose challenges for the sector [6]

Mondelēz International Names Luca Zaramella Executive Vice President, Chief Operating Officer and Chief Financial Officer
Globenewswire· 2026-01-29 21:45
Core Insights - Mondelēz International has appointed Luca Zaramella as Chief Operating Officer and Chief Financial Officer, effective February 1, 2026 [1][2] - Zaramella will oversee the company's commercial operations across four geographical regions, as well as corporate sales, marketing, and supply chain functions [1] - The company is currently searching for a successor for the CFO position and will announce it at a later date [1] Company Overview - Mondelēz International reported net revenues of approximately $36.4 billion for 2024, positioning itself as a leader in the snacking industry [3] - The company operates in over 150 countries and features iconic brands such as Oreo, Ritz, and Cadbury Dairy Milk [3] - Mondelēz is recognized as a member of the Dow Jones Best-in-Class North America and World Indices [3] Leadership Insights - Dirk Van de Put, the Chair and CEO, expressed confidence in Zaramella's ability to enhance operational excellence and accelerate performance amid a dynamic environment [2] - Zaramella has been with Mondelēz since 2018 as CFO, contributing to the development of the company's strategic growth framework and financial algorithm [2] - He has extensive experience in various senior roles across Latin America, Europe, and North America [2][3]

期货品种周报:铜铝趋势明确,适合多头;关注橡胶、豆粕空头机会
对冲研投· 2025-12-08 03:03
Group 1: Stock Index Futures - The stock index futures sector is in a "curve long" state, with IC and IM being "good curves" [1] - Key products include the Shanghai 50 (IH), CSI 300 (IF), CSI 500 (IC), and CSI 1000 (IM), all in a bullish state [1] - The market status shows a "consolidation" phase, with technical indicators indicating prices at a high level (750D Px_M Percentile > 0.95) [1] - IC and IM have the strongest curve strength, suitable for long positions, while IH and IF are slightly weaker and can serve as auxiliary positions [1] - The core logic indicates that the curve structure of small-cap indices is more favorable, reflecting optimistic expectations for their forward contracts [1] Group 2: Government Bond Futures - The government bond futures sector is in a "curve short" state, with TL showing the strongest short signal [1] - Key products include 2-year (TS), 5-year (TF), 10-year (T), and 30-year (TL) bonds, with TS in "consolidation" and TF, T, TL in "short" [1] - The 30-year bond's 750D Ctgo Percentile is at 0.965, indicating it is at a historically high position, facing adjustment pressure [1] - Opportunities exist to focus on short positions in TL and T, particularly as TL's curve structure is bearish [1] - The core logic suggests that long-term interest rate bonds face supply pressure and rising inflation expectations, suppressing bond prices [1] Group 3: Precious Metals - The precious metals sector is in a "possible curve short" state, but the market status is "bullish" [1] - Key products include gold (AU) and silver (AG), both showing high price levels (Px_M Percentile close to 1), indicating overheated market sentiment [1] - Caution is advised for pursuing long positions, with attention to potential opportunities after price corrections [1] - The core logic indicates that safe-haven sentiment and inflation expectations support prices, but the curve structure suggests insufficient premiums for forward contracts, warning of high-level adjustments [1] Group 4: Base Metals - The base metals sector shows copper (CU) and aluminum (AL) as "bullish," while zinc (ZN) is a "possible curve long," and nickel (NI) and tin (SN) are "possible curve shorts" [3] - Copper and aluminum prices are very strong, while zinc, nickel, and tin are in a "consolidation" state [3] - Opportunities for long positions exist in copper and aluminum, while zinc may present curve strengthening opportunities [3] - The core logic indicates that copper and aluminum benefit from investments in new energy and power grids, while zinc is supported by supply-side disruptions [3] Group 5: Black Metals - The black metals sector has iron ore (I) as a "good curve long," while rebar (RB) is a "possible curve short," and hot-rolled coil (HC) is in "consolidation" [3] - The market status for iron ore, rebar, and hot-rolled coil is "consolidation" [3] - Opportunities for long positions in iron ore are noted, while caution is advised for rebar [3] - The core logic suggests that iron ore is supported by supply-side factors and steel mill restocking, while rebar is constrained by weak demand [3] Group 6: Chemical Products - The chemical products sector includes crude oil (SC), low-sulfur fuel oil (LU), and asphalt (BU) as "curve long," while rubber (RU) is a "good curve short" [3] - SC, LU, and BU are in "consolidation," while RU is in a "short" state [3] - Opportunities for long positions are available in SC, LU, and BU, while RU shows a clear bearish trend [3] - The core logic indicates that energy and chemical products are supported by crude oil costs, while rubber is pressured by supply-demand imbalances [3] Group 7: Agricultural Products - The agricultural products sector includes soybean oil (Y) and palm oil (P) as "possible curve long," while soybean meal (M) is "short," and sugar (SR) is "curve long" [3] - Soybean oil and palm oil are in "consolidation," while soybean meal is in a "short" state [3] - Opportunities for long positions are noted in Y, P, and SR, while M should be avoided [3] - The core logic indicates that oilseeds are supported by recovering consumption and biodiesel policies, while soybean meal is pressured by ample supply [3] Group 8: Summary and Recommendations - Long opportunities identified include CSI 500/1000 futures, iron ore, crude oil, palm oil, and sugar [3] - Short opportunities include 30-year government bonds, rubber, and soybean meal [3] - Concentrated risk areas include potential adjustments in precious metals at high levels, demand shortfalls in black metals, and weather fluctuations affecting agricultural products [3]

期货交易中如何做到:空仓不急、持仓不慌、开仓无畏,平仓不悔
对冲研投· 2025-11-22 05:02
Group 1: Lithium Carbonate Market - Lithium carbonate has hit a trading limit down, indicating a significant market correction driven by policy intervention and fundamental market dynamics [3][4]. - Regulatory measures by the Guangxi Futures Exchange aim to prevent excessive speculation that could harm the real economy, suggesting that the market is being cooled rather than ending [3][4]. - The volatility in the lithium carbonate market reflects a disconnect between bullish price expectations and current market realities, highlighting the speculative nature of recent trading [4][5]. Group 2: Methanol Market Outlook - The 05 contract for methanol is highlighted as a potential opportunity due to expected improvements in the fundamental market conditions [7]. - Key factors influencing the methanol market include potential gas supply restrictions from Iran, domestic supply reductions, and a possible demand recovery from MTO (Methanol-to-Olefin) operations [8][9][10]. - The market sentiment is expected to shift towards a de-stocking phase starting mid-December, which could positively impact prices [12][20]. Group 3: Industrial Silicon Market - A recent conference involving major players in the organic silicon industry has led to a coordinated reduction in production, effective from December 1, which is expected to alleviate supply pressures on upstream industrial silicon [21][23]. - The price of DMC (Dimethylcyclosiloxane) has increased significantly, reflecting the industry's efforts to stabilize prices amid long-term losses and supply-demand imbalances [23]. - The market's quick response to the news indicates a strong sentiment towards self-regulation within the industry, which could bolster confidence moving forward [23]. Group 4: Nickel Market Dynamics - Nickel prices have been on a downward trend, breaking through key support levels, driven by persistent supply-demand imbalances and high inventory levels [29][30]. - The anticipated tightening of nickel supply has not materialized, leading to a bearish outlook as demand growth remains insufficient to absorb the excess supply [32][33]. - The market is expected to remain under pressure due to high inventories and a lack of significant demand recovery in the near term [33]. Group 5: Futures Market Overview - The futures market shows a clear divergence between bullish opportunities in certain commodities like iron ore and bearish trends in others like coal and agricultural products [46][49][55]. - The core logic driving these trends revolves around supply-demand dynamics, macroeconomic policies, and seasonal factors affecting various commodities [48][54][57]. - Investors are advised to adopt a diversified approach while closely monitoring market conditions and adjusting strategies accordingly [58].

期货品种周报:多空分化明显,镍空头趋势明确,铁矿石多头机会突出,白糖偏多,生猪鸡蛋继续看空
对冲研投· 2025-11-17 02:50
Core Viewpoint - The article highlights the diverse opportunities and risks in the futures market, emphasizing the differentiation between bullish and bearish trends across various sectors, particularly in stock indices and certain commodities like iron ore and sugar [43]. Group 1: Stock Index Futures - Key bullish varieties include the CSI 500 futures (IC) and CSI 1000 futures (IM), indicating a "Good Curve Long" signal, while the CSI 300 futures (IF) show a "Curve Long" signal and the SSE 50 futures (IH) are "Maybe Curve Long," suggesting an overall bullish sentiment [2]. - The market is currently in a "Consolidation" phase, indicating a period of adjustment [3]. - The volatility of stock index futures is relatively low, with a Vol/Roll ratio between 1.4 and 5.0, and a moderate rolling Sharpe ratio of approximately 0.2 to 0.7, indicating active trading with manageable volatility [4]. - High positive correlation exists among IH, IF, IC, and IM, with correlation coefficients ranging from 0.68 to 0.94, reflecting strong interconnectivity within the sector [5]. - Investment opportunities lie in bullish positions for IC and IM due to strong curve structures and high annualized rolling returns (IC at 7.35%, IM at 10.69%), while IF and IH serve as auxiliary bullish positions suitable for low-cost accumulation during consolidation [6]. - The core logic suggests that small-cap stocks are relatively strong, benefiting from structural policy support and growth expectations, although the overall market lacks trend momentum and requires a breakout signal [8]. Group 2: Government Bond Futures - No clear curve signals are present for 2-year (TS), 5-year (TF), 10-year (T), and 30-year (TL) government bond futures, with all market states classified as "Consolidation" [9]. - Annualized rolling returns are negative (TS -0.26%, TF -0.26%, T -0.02%, TL 0.54%), indicating yield pressure [9]. - The volatility is low, with a Vol/Roll ratio between 0.0004 and 0.0027, and a varied rolling Sharpe ratio (TS at 0.43, T at 0.01), reflecting subdued trading activity and weak returns [10]. - Given the lack of clear direction, it is advised to remain observant or engage in light arbitrage, such as utilizing term spread changes [11]. - The core logic indicates that economic recovery and inflation expectations suppress the bond market, while safe-haven demand provides support, leading to a continued oscillating pattern [13]. Group 3: Precious Metals - Both gold (AU) and silver (AG) are classified as "Maybe Curve Short," but the market state is "Long," indicating a divergence between technical indicators and market conditions [14]. - Annualized rolling returns are negative (AU -2.24%, AG -2.11%), reflecting a bearish curve structure [14]. - The volatility is moderate, with a Vol/Roll ratio around 0.017 to 0.021, and low rolling Sharpe ratios (AU 0.08, AG 0.06), indicating active trading but poor returns [15]. - Cautious bearish positions are suggested, with attention to potential short-selling opportunities after rebounds or utilizing AU-AG price spread arbitrage [16]. - The core logic suggests that actual interest rates and dollar strength dominate prices, with a bearish technical outlook but support from safe-haven sentiment, leading to short-term weakness [18]. Group 4: Base Metals - Copper (CU) and international copper (BC) show no curve signals, with market states classified as "Long" or "Consolidation"; zinc (ZN) is "Maybe Curve Long," while nickel (NI) is "Short" [19]. - Annualized rolling returns vary (CU -0.28%, ZN 2.14%, NI -0.87%) [19]. - The volatility is moderate, with a Vol/Roll ratio between 0.005 and 0.011, and generally low rolling Sharpe ratios (CU 0.02, ZN 0.24), indicating stable trading [20]. - Zinc presents a clear long opportunity due to its bullish curve and positive returns, while nickel's clear bearish trend suggests short-selling at high points [21]. - The core logic indicates that supply-demand balance drives prices, with support from Chinese infrastructure and new energy demand for copper and zinc, but uncertainties arise from inventory levels and macro sentiment [23]. Group 5: Black Metals - Iron ore (I) is identified as "Good Curve Long," while coking coal (JM) is "Good Curve Short," and both coke (J) and rebar (RB) are "Maybe Curve Short" [24]. - Annualized rolling returns vary (I 6.49%, JM -5.35%) [25]. - The volatility is relatively high, with a Vol/Roll ratio around 0.010 to 0.024, and moderate rolling Sharpe ratios (I 0.39, JM 0.14), indicating active trading [26]. - Iron ore presents significant bullish opportunities, supported by positive returns and curve backing, while coking coal and coke show clear bearish trends suitable for short-selling [27]. - The core logic suggests that environmental policies and production cut expectations support iron ore, while weak terminal demand suppresses coking coal and coke, leading to notable sector differentiation [29]. Group 6: Energy and Chemicals - Crude oil (SC) and low-sulfur fuel oil (LU) are "Curve Long," while fuel oil (FU) is "Good Curve Long" but in a "Short" market state, and asphalt (BU) is "Curve Long" but also "Short" [30]. - Annualized rolling returns vary (SC 3.31%, FU 6.76%, BU 3.09%) [31]. - The volatility is moderate, with a Vol/Roll ratio between 0.014 and 0.026, and varied rolling Sharpe ratios (SC 0.14, FU 0.29), indicating strong interconnectivity within the sector [32]. - High-value bullish positions are recommended for SC and LU, benefiting from curve support and positive returns, while FU and BU require cautious validation due to their bearish market states [33]. - The core logic indicates that global crude oil supply-demand tightness supports prices, but downstream demand differentiation and chemical products are influenced by both cost and demand factors [36]. Group 7: Agricultural Products - Sugar (SR) is "Curve Long," soybean (A) is "Maybe Curve Long," palm oil (P) is "Good Curve Long" but in a "Short" market state, while rapeseed oil (OI) and rapeseed meal (RM) are "Maybe Curve Short," and live hogs (LH) and eggs (JD) are "Curve Short" [37]. - Annualized rolling returns vary (SR 3.58%, P 7.81%, LH -3.64%) [37]. - The volatility ranges from low to moderate, with a Vol/Roll ratio between 0.004 and 0.015, and moderate rolling Sharpe ratios (SR 0.56, LH 0.16) [38]. - Clear bullish opportunities exist for sugar and soybean, benefiting from curve support and positive returns, while palm oil's bullish curve requires waiting for stronger signals, and live hogs and eggs show clear bearish trends suitable for short-selling [40]. - The core logic indicates that supply-side factors (planting area, yield) and demand-side factors (feed, consumption) dominate, with significant differentiation among varieties and a need to monitor seasonal factors and global trade flows [42].

商品日报(10月23日):焦煤增仓大涨 原油强势反弹
Xin Hua Cai Jing· 2025-10-23 11:33
Group 1 - Domestic commodity futures market saw widespread gains on October 23, with coking coal main contract rising over 5%, and other contracts like coke, lithium carbonate, and SC crude oil increasing over 4% [1][2] - The China Securities Commodity Futures Price Index closed at 1475.19 points, up 12.28 points or 0.84% from the previous trading day, while the China Securities Commodity Futures Index closed at 2035.40 points, up 16.94 points or 0.84% [1] Group 2 - The energy and chemical sector performed particularly well, driven by geopolitical tensions and a decrease in U.S. crude oil inventories, which improved market sentiment [2][3] - Coking coal prices surged over 5% due to supply concerns from environmental regulations and reduced imports, reaching a two-month high [3] - Strong downstream demand for lithium carbonate led to a price increase of over 4% [3] Group 3 - The palm oil market remained weak, with the main contract falling over 1%, influenced by slowing export growth and increasing domestic inventory [4] - Precious metals experienced slight fluctuations, with silver rising over 1% while gold fell by 0.77%, indicating uncertainty in future price movements [4]

Mondelēz International State of Snacking Survey: Holiday Memories Help Shape Our Snacking Choices
Globenewswire· 2025-10-16 13:05
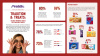
Core Insights - The holiday season significantly influences snacking choices, with traditions and childhood memories playing a crucial role in consumer behavior [1][5][7] - The State of Snacking report, developed with The Harris Poll, highlights the global impact of cultural celebrations on snacking habits, particularly in Asian cultures [2][5] Company Overview - Mondelēz International, Inc. reported net revenues of approximately $36.4 billion for 2024, positioning itself as a leader in the snacking industry with a diverse portfolio of iconic brands [4] Consumer Behavior - A strong connection exists between snacking and cherished childhood experiences, with 76% of consumers recalling fond memories of sharing snacks with parents [5] - 78% of global consumers enjoy sharing their favorite childhood snacks, with particularly high rates in the Philippines, Indonesia, China, and India [5] - 73% of consumers believe certain snacks have been passed down through generations, especially in Indonesia, India, and the Philippines [5]