政策预期
Search documents
远期政策预期依然强 多晶硅期货波动率较高
Jin Tou Wang· 2025-10-27 06:07
Core Viewpoint - The domestic futures market for non-ferrous metals is showing a predominantly positive trend, particularly in polysilicon futures, which have experienced a price increase of 2.20% [1] Group 1: Market Performance - Polysilicon futures opened at 52,510.0 yuan/ton and reached a high of 53,795.0 yuan, with a low of 52,425.0 yuan during the trading session [1] - The current market trend for polysilicon is characterized by a strong upward movement, indicating robust performance [1] Group 2: Industry Analysis - New Lake Futures highlights that the market is currently focused on fundamental factors, with a loose industry environment. Supply-side reductions are insufficient, while demand is decreasing, leading to accelerated inventory accumulation of silicon materials [1] - Zhonghui Futures notes a contrast between strong expectations and weak realities, with no further market news on capacity integration affecting market sentiment. However, effective cost support and strong spot prices suggest that buying on dips may offer better value [1] - Nanhua Futures points out that the volatility of polysilicon futures is significantly higher than that of lithium carbonate and industrial silicon, indicating a higher overall risk level. Investors are advised to participate cautiously and manage their positions and risk hedging effectively [1]
板块轮动到谁了?沪指逼近4000点 机构正大幅买入这些主题ETF
Mei Ri Jing Ji Xin Wen· 2025-10-25 04:54
Market Overview - The Shanghai Composite Index has surged past 3950 points, reaching a nearly ten-year high and approaching the 4000-point mark [1][2] - The total trading volume for the week in the Shanghai and Shenzhen markets was 8.9 trillion yuan, with the Shanghai market accounting for 3.93 trillion yuan and the Shenzhen market for 4.97 trillion yuan [2] ETF Fund Flows - Over 200 billion yuan has flowed out of stock and cross-border ETFs this week, with a net outflow of 212 billion yuan from thematic industry ETFs [2][15] - Major broad-based index ETFs experienced a net outflow of 88.41 billion yuan, with the ChiNext ETF seeing a net outflow of 37.16 billion yuan [8][15] Sector Performance - The brokerage and robotics ETFs have attracted significant capital, with net inflows of 9.87 billion yuan and 7.06 billion yuan, respectively [13][17] - Conversely, the artificial intelligence and new energy vehicle-related ETFs faced substantial outflows, with net outflows of 8.81 billion yuan and 5.93 billion yuan, respectively [15][17] Notable ETF Movements - The brokerage ETF (512000) saw its shares increase by 16.76 billion, reaching a new high of 649.19 billion shares [16][17] - The robotics ETF (562500) also experienced a rise, with shares reaching 226.54 billion, marking a new high [17] Upcoming ETF Issuance - Six new ETFs are set to be issued next week, tracking sectors such as the satellite industry, technology, and photovoltaic industries [25][26]

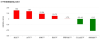
有色金属周度报告-20251024
Xin Ji Yuan Qi Huo· 2025-10-24 12:04
Group 1: Report Overview - The report is a weekly report on non-ferrous metals by New Era Futures Research, dated October 24, 2025 [1] Group 2: Metal Price Movements - Copper: The futures price of CU2512 rose from 84,390 to 87,720, a weekly increase of 3,330 or 3.95%. The spot price of 1 copper in Shanghai increased from 84,850 to 86,400, up 1,550 or 1.83% [2] - Aluminum: The futures price of AL2512 increased from 20,910 to 21,225, a weekly rise of 315 or 1.51%. The spot price of A00 aluminum in Shanghai went up from 20,940 to 21,110, an increase of 170 or 0.81% [2] - Zinc: The futures price of ZN2512 climbed from 21,830 to 22,355, a weekly gain of 525 or 2.40%. The spot price of 0 zinc in Shanghai increased from 21,880 to 22,200, up 320 or 1.46% [2] - Lead: The futures price of PB2512 rose from 17,090 to 17,595, a weekly increase of 505 or 2.95%. The spot price of 1 lead ingot rose from 16,900 to 17,300, up 400 or 2.37% [2] - Nickel: The futures price of NI2512 increased from 121,330 to 122,150, a weekly gain of 820 or 0.68%. The spot price of 1 electrolytic nickel went up from 122,350 to 122,900, an increase of 550 or 0.45% [2] - Alumina: The futures price of AO2601 increased slightly from 2,800 to 2,810, a weekly rise of 10 or 0.36%. The spot price of alumina in Foshan decreased from 2,990 to 2,950, a decline of 40 or -1.34% [2] - Industrial Silicon: The futures price of SI2601 rose from 8,800 to 8,920, a weekly increase of 120 or 1.36%. The spot price of 553 silicon decreased from 9,500 to 9,400, a decline of 100 or -1.05% [2] - Lithium Carbonate: The futures price of LC2601 increased from 75,780 to 79,520, a weekly gain of 3,740 or 4.94%. The spot price of battery - grade lithium carbonate (99.5%) rose from 73,850 to 75,400, up 1,550 or 2.10% [2] - Polysilicon: The futures price of PS2601 decreased from 54,850 to 52,305, a weekly decline of 2,545 or -4.64%. The spot price of N - type polysilicon material increased from 52,800 to 52,980, up 180 or 0.34% [2] Group 3: Metal Inventory Changes - Copper: As of October 24, SHFE copper inventory was 104,800 tons, a decrease of 5,400 tons or -4.90% from last week. LME copper inventory was 136,400 tons, a decrease of 800 tons or -0.58% from last week. As of October 23, COMEX copper inventory was 347,500 tons, an increase of 2,800 tons or +0.81% from last week [13][14] - Zinc: As of October 24, LME zinc inventory was 37,600 tons, a decrease of 400 tons or -1.13% from last week. SHFE zinc inventory was 65,800 tons, a decrease of 1,500 tons or -2.23% from last week [23] - Aluminum: As of October 24, LME aluminum inventory was 473,100 tons, a decrease of 18,100 tons from last week. SHFE aluminum inventory was 118,200 tons, a decrease of 3,900 tons from last week. COMEX aluminum inventory was 7,422 tons, an increase of 761 tons from last week [40][41] Group 4: Processing Fees and Indexes - Copper Concentrate: As of October 23, the spot TC of copper concentrate was -40.70 dollars/ton, remaining unchanged weekly, and the tight supply expectation at the mine end still exists [17] - Lithium Spodumene Concentrate: As of October 24, the latest quote was 881 dollars/ton, a weekly increase of 35 dollars/ton [20] - Zinc Concentrate: As of October 24, the main port TC of zinc concentrate was 105 dollars/ton, remaining the same as on October 17 [24] Group 5: Demand - Side Analysis - Automobile: In August, automobile production and sales reached 2.815 million and 2.857 million units respectively, with a month - on - month increase of 8.7% and 10.1%, and a year - on - year increase of 13% and 16.4%. From January to August, automobile production and sales were 21.051 million and 21.128 million units respectively, with a year - on - year increase of 12.7% and 12.6%. In August, new energy vehicle production and sales were 1.391 million and 1.395 million units respectively, with a year - on - year increase of 27.4% and 26.8%, and new energy vehicle sales accounted for 48.8% of total vehicle sales [44] - Real Estate: From January to August, the floor area under construction of real estate development enterprises was 6.431 billion square meters, a year - on - year decrease of 9.3%. The new construction area was 398 million square meters, a decrease of 19.5% [46] - Power Generation: As of the end of August, the cumulative installed power generation capacity nationwide was 3.69 billion kilowatts, a year - on - year increase of 18.0%. Among them, solar power installed capacity was 1.12 billion kilowatts, a year - on - year increase of 48.5%, and wind power installed capacity was 580 million kilowatts, a year - on - year increase of 22.1% [48] Group 6: Strategy Recommendations Alumina and Aluminum - Short - term: Alumina is expected to run weakly and oscillatingly; Shanghai aluminum is expected to run strongly and oscillatingly [51] - Long - term: Terminal demand remains resilient. Considering the US dollar interest - rate cut rhythm and positive macro sentiment, Shanghai aluminum is expected to run strongly and oscillatingly [51] Polysilicon - Short - term: For polysilicon, policy influence continues to ferment, with short - term high - level range oscillation. For industrial silicon, as the wet season in the southwest ends and electricity prices rise, manufacturers will arrange production cuts at the end of the month, and the production cost of industrial silicon may increase. Attention should be paid to policy expectation guidance [55] - Long - term: The industry's over - supply pattern has not been reversed. Attention should be paid to the policy implementation rhythm and actual demand follow - up [55]
黄金急跌近2%,失守4060美元/盎司
2 1 Shi Ji Jing Ji Bao Dao· 2025-10-24 09:28
Core Viewpoint - The rapid decline in gold and silver prices is attributed to multiple factors including policy expectations, technical breakdowns, a stronger dollar, and reduced geopolitical risks [3] Price Movements - As of October 24, spot gold fell below $4060 per ounce, dropping over 1.85% during the day [1] - Spot silver touched $47 per ounce, declining over 2% [1] - COMEX gold futures saw a decline of nearly 2%, approaching $4060 per ounce, with a current drop of 1.79% [1] - Current prices include: - London Gold: $4050.228, down $76.262 (-1.85%) [2] - London Silver: $47.850, down $0.996 (-2.04%) [2] - COMEX Gold: $4071.3, down $74.3 (-1.79%) [2] - COMEX Silver: $47.615, down $1.089 (-2.24%) [2] Market Sentiment - U.S. gold stocks fell in pre-market trading, with Coeur Mining down over 4% and both Kinross and Harmony Gold down more than 2% [2] - Citigroup has turned bearish on gold prices, predicting a drop to $4000 within the next three months [3] Long-term Outlook - Despite the short-term decline, long-term support for gold is expected from global economic recession risks and central bank gold purchases, with a projected net increase of over 1000 tons by central banks in 2025 [3] - Investors are advised to closely monitor the upcoming October CPI data (to be released on the 25th) and the Federal Reserve's meeting statements to gauge market direction changes [3]

矿业ETF(561330)盘中涨超1.8%,工业金属供应扰动与政策预期受关注
Mei Ri Jing Ji Xin Wen· 2025-10-24 06:15
Group 1 - The industrial metals sector is expected to see rising copper prices due to disruptions at the mining level and anticipated "anti-involution" policies in smelting [1] - Freeport Indonesia may suspend operations at the Manyar smelter due to a mudflow incident at the Grasberg copper mine, which has an annual processing capacity of approximately 1.7 million tons of copper concentrate, potentially impacting Indonesia's copper smelting capacity and export plans [1] - In September, China's PPI year-on-year decline narrowed by 0.6 percentage points, indicating resilience in the demand side for industrial metals [1] Group 2 - The aluminum industry is facing frequent unexpected events in the upstream resource sector, highlighting supply vulnerabilities, leading to a trend towards integrated operations within the industry [1] - Export controls in the rare earth sector are being strengthened, with secondary resource recycling now included in the control measures, further tightening supply constraints, which may benefit the mid-heavy rare earth industry chain in the short term [1] - The mining ETF (561330) tracks the non-ferrous mining index (931892), which selects securities from companies involved in the development of copper, aluminum, lead-zinc, and rare metals to reflect the overall performance of the non-ferrous metal mining industry [1]
股票私募仓位创近一年新高 头部私募仓位超80%
Xin Hua Cai Jing· 2025-10-24 03:21
Core Insights - The overall stock private equity positions have reached a nearly one-year high, with large private equity firms, especially those with assets between 5 billion to 10 billion yuan, showing the most aggressive positions [1][4] Group 1: Market Sentiment - As of October 17, 2025, the stock private equity position index rose to 79.68%, an increase of 0.55% from the previous week, marking a nearly one-year high [1] - Since August 2025, the index has cumulatively increased by 5.75%, indicating a significant trend of increasing positions [1] - The A-share market has shown a fluctuating upward trend, with certain growth and consumer sectors experiencing clear upward movements, attracting more private equity investments [1] Group 2: Policy and Economic Environment - Continuous improvement in policy expectations has been noted, with recent signals from the policy level aimed at stabilizing growth and encouraging innovation [1] - Multiple policies supporting the real economy and capital market development have been introduced, enhancing private equity firms' confidence in the market's medium to long-term performance [1] Group 3: Fund Positioning - As of October 17, 2025, 63.40% of stock private equity firms are fully invested, while 20.41% are at medium positions, and only 11.47% and 4.72% are at low and empty positions, respectively [3] - The majority of private equity firms believe the current market is in a low recovery phase, and any positive news could trigger a rapid increase, prompting them to maintain full positions to avoid missing out [3] Group 4: Position Index by Fund Size - The position index for private equity firms of various sizes as of October 17, 2025, is as follows: - Over 100 billion yuan: 80.18% - 50-100 billion yuan: 87.35% - 20-50 billion yuan: 76.68% - 10-20 billion yuan: 78.09% - 5-10 billion yuan: 80.79% - 0-5 billion yuan: 79.65% [4][5] - The 50-100 billion yuan private equity firms have the highest position at 87.35%, a three-year high, while over 100 billion yuan firms maintain a position above 80% for two consecutive weeks [4]

黑色建材日报-20251024
Wu Kuang Qi Huo· 2025-10-24 01:11
Group 1: Report Industry Investment Rating - No relevant information provided Group 2: Core Viewpoints of the Report - In the long - term, under the background of the gradually loosening macro - environment, the logic of steel price trends remains unchanged; in the short - term, the weak real demand for steel is difficult to improve significantly [3] - For iron ore, the demand weakens after the decline of hot metal production, and the continuous accumulation of port inventory puts pressure on prices. The market is in a state of weak reality and macro - expectation tug - of - war, with prices oscillating [6] - For the black sector, it is not pessimistic about the future. It is considered that the cost - performance of finding callback positions to do rebounds may be higher than short - selling [11] - For industrial silicon, it is expected to oscillate in the short - term, following the commodity environment, and the trend of coking coal futures has a certain driving effect on its price [14] - For polysilicon, the current price fluctuation is regarded as a phased correction within the oscillation range, and attention should be paid to the progress of platform companies [16] - For glass, in the short - term, without external factors, the market is expected to remain weak [19] - For soda ash, the market is expected to continue to oscillate weakly in the short - term [21] Group 3: Summary by Related Catalogs Steel Market Quotes - The closing price of the rebar main contract was 3047 yuan/ton, up 2 yuan/ton (0.065%) from the previous trading day. The registered warehouse receipts were 129,796 tons, with no change. The main contract position was 1.995833 million lots, down 10,093 lots. The Tianjin aggregated price of rebar was 3110 yuan/ton, and the Shanghai aggregated price was 3200 yuan/ton, both with no change [2] - The closing price of the hot - rolled coil main contract was 3219 yuan/ton, up 4 yuan/ton (0.124%) from the previous trading day. The registered warehouse receipts were 113,657 tons, down 2375 tons. The main contract position was 1.509998 million lots, up 6767 lots. The Lecong aggregated price of hot - rolled coil was 3230 yuan/ton, down 10 yuan/ton; the Shanghai aggregated price was 3270 yuan/ton, with no change [2] Strategy Views - Rebar supply and demand both increased, and inventory decreased, showing a neutral performance; hot - rolled coil production decreased slightly, demand rebounded, inventory decreased marginally but remained at a relatively high level, and the inventory contradiction was slightly relieved. The steel mill profitability rate declined significantly recently, and the hot metal production decreased significantly, reducing the supply - side pressure marginally [3] Iron Ore Market Quotes - The main contract of iron ore (I2601) closed at 777.00 yuan/ton, with a change of +0.39% (+3.00), and the position changed by +2978 lots to 561,100 lots. The weighted position of iron ore was 941,900 lots. The spot price of PB powder at Qingdao Port was 783 yuan/wet ton, with a basis of 55.33 yuan/ton and a basis rate of 6.65% [5] Strategy Views - Supply: The overseas iron ore shipment volume rebounded in the latest period and was at a high level in the same period. The shipments from Australia and Brazil both increased, the shipment of FMG was strong, and the shipment from non - mainstream countries rebounded slightly. The near - end arrival volume decreased month - on - month [6] - Demand: The average daily hot metal production in the latest period was 239.9 tons, falling below 240 tons, mainly affected by the weak steel price, the decline of steel mill profitability to the lowest level of the year, and the environmental protection issues in Hebei affecting blast furnace production [6] - Inventory: Port inventory continued to increase, and steel mill inventory increased slightly [6] Manganese Silicon and Ferrosilicon Market Quotes - On October 23, the main contract of manganese silicon (SM601) closed up 0.14% at 5818 yuan/ton. The spot price of 6517 manganese silicon in Tianjin was 5720 yuan/ton, converted to the futures price of 5910 yuan/ton, with no change from the previous day, and the premium to the futures price was 92 yuan/ton [9] - The main contract of ferrosilicon (SF601) closed up 0.65% at 5574 yuan/ton. The spot price of 72 ferrosilicon in Tianjin was 5650 yuan/ton, with no change from the previous day, and the premium to the futures price was 76 yuan/ton [9] Strategy Views - The uncertainty of Sino - US trade friction has put pressure on commodities. Most of the current situation has been priced in, and subsequent macro - level factors may be more important [10] - For the black sector, it is not pessimistic. It is considered that the cost - performance of finding callback positions to do rebounds may be higher. Manganese silicon and ferrosilicon are likely to follow the black sector's trend [11] Industrial Silicon and Polysilicon Market Quotes - Industrial silicon: The main contract of industrial silicon futures (SI2511) closed at 8705 yuan/ton, with a change of +2.59% (+220). The weighted contract position changed by +103 lots to 438,582 lots. The spot price of non - oxygen - blown 553 in East China was 9300 yuan/ton, with no change, and the basis of the main contract was 595 yuan/ton; the price of 421 was 9650 yuan/ton, with no change, and the basis of the main contract was 145 yuan/ton [13] - Polysilicon: The main contract of polysilicon futures (PS2511) closed at 50760 yuan/ton, with a change of +0.89% (+450). The weighted contract position changed by - 3824 lots to 243,675 lots. The average price of N - type granular silicon was 50.5 yuan/kg, with no change; the average price of N - type dense material was 51.5 yuan/kg, with no change; the average price of N - type re - feeding material was 52.98 yuan/kg, down 0.02 yuan/kg, and the basis of the main contract was 2220 yuan/ton [15] Strategy Views - Industrial silicon: The supply shows a pattern of "increasing in the north and decreasing in the south", and the supply pressure still exists. The demand is mainly restricted by supply. The cost provides support for the price, and it is expected to oscillate in the short - term [14] - Polysilicon: The over - expected increase in silicon material production in October and the decrease in downstream silicon wafer production lead to continuous inventory accumulation pressure. The supply pressure will be relieved if the leading enterprises start maintenance at the end of the month. The current price fluctuation is a phased correction [16] Glass and Soda Ash Market Quotes - Glass: On Thursday at 15:00, the main contract of glass closed at 1108 yuan/ton, up 1.28% (+14). The price of large - size glass in North China was 1140 yuan, with no change; the price in Central China was 1150 yuan, with no change. The weekly inventory of float glass sample enterprises was 66.613 million boxes, up 2.3374 million boxes (+3.64%). The top 20 long - position holders increased their positions by 12,367 lots, and the top 20 short - position holders decreased their positions by 6711 lots [18] - Soda ash: On Thursday at 15:00, the main contract of soda ash closed at 1235 yuan/ton, up 0.98% (+12). The price of heavy soda ash in Shahe was 1185 yuan, up 12 yuan. The weekly inventory of soda ash sample enterprises was 1.7021 million tons, up 0.16 million tons (+3.64%), among which the inventory of heavy soda ash was 934,500 tons, down 62,000 tons, and the inventory of light soda ash was 767,600 tons, up 78,000 tons. The top 20 long - position holders increased their positions by 3131 lots, and the top 20 short - position holders increased their positions by 4848 lots [20] Strategy Views - Glass: Entering the end of the traditional peak season, the downstream procurement rhythm slows down further, and the supply rebounds. The supply - demand contradiction is difficult to resolve in the short - term, and the market is expected to remain weak [19] - Soda ash: The industry shows a pattern of strong supply and weak demand. The inventory is at a high level in the same period, and the market is expected to continue to oscillate weakly in the short - term [21]
市场主流观点汇总-20251022
Guo Tou Qi Huo· 2025-10-22 10:28
Report Summary 1. Report Purpose - The report objectively reflects the research views of futures and securities companies on various commodity varieties, tracks hot varieties, analyzes market investment sentiment, and summarizes investment driving logic [1]. 2. Market Data 2.1 Commodities - Gold closed at 999.80 with a weekly increase of 10.90%, silver at 12249.00 with a 10.53% increase, and polycrystalline silicon at 52340.00 with a 6.89% increase. - Crude oil closed at 432.60 with a 6.34% decrease, glass at 1095.00 with a 9.28% decrease, and PTA at 4402.00 with a 2.91% decrease [2]. 2.2 A - shares - The Shanghai - Shenzhen 300 Index closed at 4514.23 with a 2.22% decrease, the CSI 500 Index at 7016.07 with a 5.17% decrease, and the Shanghai Composite 50 Index at 2967.77 with a 0.24% decrease [2]. 2.3 Overseas Stocks - The Nasdaq Index closed at 22679.97 with a 3.24% increase, the S&P 500 Index at 6664.01 with a 1.70% increase, and the Hang Seng Index at 25247.10 with a 3.97% decrease [2]. 2.4 Bonds - The yield of the 2 - year Chinese Treasury bond was 1.50 with an increase of 1.25 bp, the 10 - year was 1.84 with a 0.5 bp decrease, and the 5 - year was 1.60 with a 0.13 bp increase [2]. 2.5 Foreign Exchange - The US dollar index closed at 98.56 with a 0.27% decrease, the US dollar central parity rate at 7.09 with a 0.14% decrease, and the euro - US dollar exchange rate at 1.17 with a 0.24% increase [2]. 3. Commodity Views 3.1 Macro - financial Sector - **Stock Index Futures** - Strategy views: Among 8 institutions, 1 is bullish, 0 is bearish, and 7 expect a sideways trend. - Bullish logic: Sino - US trade talks, Fed rate - cut expectations, potential RMB appreciation, stable market expectations, and improved domestic M1 growth [4]. - Bearish logic: Profit - taking in the technology sector, low risk appetite before Sino - US trade resolution, limited policy stimulus, and reduced A - share trading volume [4]. - **Treasury Bond Futures** - Strategy views: Among 7 institutions, 3 are bullish, 0 is bearish, and 4 expect a sideways trend. - Bullish logic: Weak economic data, loose liquidity, and market risk aversion [4]. - Bearish logic: Potential incremental policies, unimplemented domestic rate cuts, and possible recovery of risk assets [4]. 3.2 Energy Sector - **Crude Oil** - Strategy views: Among 9 institutions, 1 is bullish, 4 are bearish, and 4 expect a sideways trend. - Bullish logic: Sino - US trade talks, approaching break - even price, undervalued fundamentals, and US strategic oil purchase [5]. - Bearish logic: Saudi production increase, EU's call for end of war, rising Russian exports, high US inventory, and expected supply surplus [5]. 3.3 Agricultural Products Sector - **Palm Oil** - Strategy views: Among 8 institutions, 3 are bullish, 1 is bearish, and 4 expect a sideways trend. - Bullish logic: Limited production potential, policy plans, low import data, and stable spot prices [5]. - Bearish logic: Increased Malaysian production, falling oil prices, low cost - effectiveness, and weak market sentiment [5]. 3.4 Non - ferrous Metals Sector - **Aluminum** - Strategy views: Among 7 institutions, 2 are bullish, 0 is bearish, and 5 expect a sideways trend. - Bullish logic: Fed rate - cut expectations, low supply, seasonal demand, long - term demand growth, and policy support [6]. - Bearish logic: Trade friction risks, hedging pressure, low market attention, and weak spot trading [6]. 3.5 Chemical Sector - **Glass** - Strategy views: Among 7 institutions, 0 is bullish, 2 are bearish, and 5 expect a sideways trend. - Bullish logic: Positive sentiment during meetings, cost support, reduced inventory, and policy expectations [6]. - Bearish logic: High intermediate inventory, unclear production - cut policies, low orders, and weak real - estate data [6]. 3.6 Precious Metals Sector - **Gold** - Strategy views: Among 7 institutions, 0 is bullish, 0 is bearish, and 7 expect a sideways trend. - Bullish logic: Geopolitical tensions, Fed rate - cut expectations, repeated conflicts, and central bank gold purchases [7]. - Bearish logic: Reduced US banking concerns, short - term profit - taking, and a stronger US dollar [7]. 3.7 Black Metals Sector - **Coking Coal** - Strategy views: Among 8 institutions, 3 are bullish, 1 is bearish, and 4 expect a sideways trend. - Bullish logic: Safety inspections, supply disruptions, high iron - water production, and positive market sentiment [7]. - Bearish logic: Reduced steel - mill profits, stable supply, weak demand, and unclear trade friction [7].
纯碱、玻璃日报-20251021
Jian Xin Qi Huo· 2025-10-21 01:36
Report Information - Report Name: Soda Ash, Glass Daily Report [1] - Date: October 21, 2025 [2] - Research Team: Energy and Chemical Research Team [4] Industry Investment Rating - Not provided Core Viewpoints - The soda ash market has a weak supply - demand pattern with supply affected by equipment maintenance, downstream low - price restocking, and insufficient fundamental drivers. The market supply - demand imbalance persists. The contract shows signs of bottom - building and is expected to oscillate weakly [8]. - The glass market is in a weak supply - demand balance. The post - festival factory inventory remains high, and the demand for float glass may not continue to rise. The market may experience a second bottom - testing, but excessive short - selling is not advisable. Attention should be paid to potential positive factors from policies and production line changes [9][10]. Summary by Directory 1. Soda Ash and Glass Market Review and Operation Suggestions Soda Ash - **Market Data**: On October 21, the main soda ash futures SA601 contract oscillated. The closing price was 1,219 yuan/ton, and the position decreased by 36,196 lots [7]. - **Fundamentals**: Weekly production decreased by 30,300 tons to 740,500 tons, a 3.93% week - on - week decline. The alkali plant inventory reached 1.705 million tons, at a low level in the past six months. The total shipment volume of Chinese soda ash enterprises at the end of September was 881,000 tons, a 11.86% increase from the previous period. The demand for heavy soda ash changed little [8]. - **Outlook**: It is expected to oscillate weakly due to the lack of substantial positive factors [8]. Glass - **Market Data**: On October 21, FG601 closed at 1,091 yuan/ton, down 27 yuan or 2.41%; FG603 closed at 1,161 yuan/ton, down 27 yuan or 2.27% [7]. - **Fundamentals**: Float glass production was stable, and the photovoltaic glass was in a weak balance. The overall glass supply was at a high level this year. The post - festival factory inventory remained high, and the real - estate market showed no signs of stabilization [9]. - **Outlook**: The market may experience a second bottom - testing, but attention should be paid to potential positive factors from policies and production line changes [9][10]. 2. Data Overview - The report provides multiple data charts including soda ash weekly production, soda ash enterprise inventory, soda ash active contract price trend, glass active contract price trend, central China heavy soda market price, and flat glass production, with data sources from Wind, iFind, and the research and development department of Jianxin Futures [14][16][20]
双焦周报20251020:供应扰动加剧,双焦震荡偏强-20251020
Hong Ye Qi Huo· 2025-10-20 09:03
Report Industry Investment Rating - No relevant content provided Core Viewpoints - Last week, the coking coal market was generally strong, with both supply and demand showing signs of recovery, but policy and sentiment disturbances increased market volatility. Coking coal is expected to oscillate at a high level in the short term [5]. - Last week, the coke market oscillated strongly, and the second round of spot price increases was initiated. Coke is expected to follow coking coal to oscillate at a high level in the short term, and attention should be paid to the fulfillment of policy expectations and changes in demand at the finished product end [6]. Summaries by Sections Market Views Coking Coal Fundamentals - Supply: The开工 rate of 523 sample mines and the daily average output of clean coal increased month - on - month, and the capacity utilization rate and clean coal output of 314 coal washing plants also increased slightly. However, due to safety inspections and over - production checks, the supply recovery space is limited [5]. - Demand: The daily output of molten iron and the blast furnace operating rate of 247 steel mills remained stable at a high level, and the available days of coking coal for steel mills and coking plants increased slightly, indicating that rigid demand is still supported [5]. - Inventory: Except for a significant decline in port inventory, mines, coal washing plants, and downstream sectors all saw inventory accumulation, and downstream sectors still have some inventory replenishment momentum [5]. - Summary: In the short term, the fundamental contradictions of coking coal are not significant. The expectation of supply contraction and winter storage demand jointly support prices, but the upside is still restricted by the profit of finished products and the effect of policy implementation [5]. Coke Fundamentals - Supply: The average profit per ton of coke for coking plants returned below the break - even line, and the production willingness of coking enterprises decreased slightly. The capacity utilization rate and output decreased month - on - month [6]. - Demand: The daily output of molten iron and the blast furnace operating rate of 247 steel mills remained stable, the inventory usage cycle of steel mills decreased slightly, and rigid demand was resilient [6]. - Inventory: The inventory of coking plants and steel mills decreased, the port inventory remained stable, and the overall explicit inventory decreased, indicating that the market supply - demand structure is approaching a tight balance [6]. - Summary: In the short term, the coke fundamentals are tight. The second round of price increases is likely to be implemented, but the future continuous increase space may be limited. Coke is expected to follow coking coal to oscillate at a high level [6]. Macro - real Estate Tracking - The report presents data on the cumulative year - on - year growth rate of national fixed - asset investment, the cumulative year - on - year growth rate of new construction, construction, and completion areas of national real estate, the weekly commercial housing transaction area of 30 large - and medium - sized cities, and the purchasing managers' index (PMI) of the steel industry, but no specific analysis is provided [8][11][15][17] Coking Coal Supply - demand Tracking - Coking coal spot prices have risen [21]. - Mines have shifted from destocking to stockpiling, and the inventory of coal washing plants has gradually recovered [34]. - The customs clearance volume of Mongolian coal has rebounded to a high level [47]. Coke Supply - demand Tracking - The second round of price increases for coke has been initiated, and attention should be paid to the actual implementation rhythm [55]. - Due to cost increases, the profit per ton of coke for coking enterprises has fallen below the break - even line [59]. - Independent coking plants have slightly reduced their inventory, and steel mills have shifted from previous inventory replenishment to destocking [69]. - The port coke inventory has stabilized [73].