牛市
Search documents
中美吉隆坡磋商多项议题形成初步共识,沪指逼近4000点
Nan Fang Du Shi Bao· 2025-10-27 04:55
10月27日早盘板块题材上,钢铁、小金属、可控核聚变、存储芯片板块涨幅居前。钢铁板块中,安阳钢 铁、常宝股份、新兴铸管涨停领涨;小金属板块厦门钨业涨停,中钨高新、东方钽业涨超7%;可控核 聚变板块安泰科技、纽威股份涨停;存储芯片股晶瑞电材、伟测科技、联瑞新材涨超10%;大卫股份、 中电港、时空科技、盈新发展涨停。 "进入四季度,市场风格出现一定切换,但大方向来看,当前市场依然处于牛市氛围之中",前海开源基 金首席经济学家、基金经理杨德龙认为,场外资金加速入场,外资投行纷纷看好中国资产,四季度居民 储蓄向资本市场转移的趋势不会改变。随着股市重心上移,越来越多的板块有机会轮动上涨,这将使更 多投资者获得较好回报,形成正向循环,促进资本市场进一步回升,同时推动消费增长,有效化解许多 行业产能过剩的局面。 10月26日,据新华社报道,中美双方在吉隆坡举行经贸磋商,就稳妥解决多项重要经贸议题形成初步共 识。10月27日,A股三大指数高开,截至午盘均涨超1%,其中沪指报3991.35,涨1.04%,深证成指报 13457.28,涨1.26%,创业板指报3220.52,涨1.54%,三市半日成交额15760亿元,较上一交易 ...


牛市与长期投资方法
雪球· 2025-10-27 04:29
Core Viewpoint - The article emphasizes the importance of long-term investment strategies over short-term market fluctuations, suggesting that true financial freedom is achieved through consistent, well-researched investments rather than relying on market trends or bull markets [2][3]. Group 1: Market Observations - The stock market has experienced significant growth, with the ChiNext index rising by 125% over five months, indicating a period of extreme market enthusiasm since 2008 [2]. - Historical patterns show that despite numerous bull markets, only a small fraction of investors achieve financial independence, highlighting the disparity between market performance and individual investment success [2]. Group 2: Investment Philosophy - Investment should be viewed as a long-term endeavor, focusing on achieving financial freedom rather than short-term gains, making market volatility less significant [3]. - The article critiques the current investment literature for being overly theoretical and lacking practical, up-to-date case studies that demonstrate effective investment analysis methods [3]. Group 3: Information Processing - In the era of abundant information, the ability to effectively process and interpret data is crucial for making informed investment decisions, necessitating a robust information management system [4]. - Developing a strong commercial understanding and insight is essential for investors, which requires ongoing personal development and commitment [4]. Group 4: Learning and Growth - The article stresses the long-term benefits of continuous learning in investment, suggesting that the differences in wealth accumulation become pronounced over extended periods, such as five to ten years [4].

中信建投:“十五五”规划有望进一步夯实牛市基础
Di Yi Cai Jing· 2025-10-26 23:54
Group 1 - The "14th Five-Year" plan has been released, which is expected to enhance market risk appetite in the short term due to increased policy clarity [1] - The long-term vision of the "14th Five-Year" plan outlines a modern industrial system blueprint, providing a clear growth path for A-shares, potentially solidifying the foundation for a bull market through technological breakthroughs and industrial upgrades [1] Group 2 - Key industries to focus on include AI, semiconductors, robotics, batteries, innovative pharmaceuticals, non-ferrous metals, machinery, military industry, social services, and large finance [1]
牛还在吗?
集思录· 2025-10-26 13:48
Group 1 - The current market sentiment is uncertain, with some investors feeling anxious about being fully invested as the bull market may be ending [1][5]. - There is a belief that the bull market's sustainability can be assessed through the performance of key indices, such as the China Securities Bank Index, which peaked on July 10, indicating a potential end to the bull market [5]. - Investors are adopting cautious strategies, with some reducing their positions to mitigate risks, suggesting a shift in market confidence [3][8]. Group 2 - Agricultural Bank of China has shown strong performance, achieving a 15-day consecutive rise with a cumulative increase of nearly 25%, bringing its total market capitalization close to 2.9 trillion [9]. - The trading volume is highlighted as a critical indicator of market health, with low volume suggesting a potential end to the bull market [8].

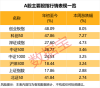
科技赛道,火爆!看涨占比翻倍
Zheng Quan Shi Bao· 2025-10-26 10:29
Group 1 - The A-share market has shown a strong performance year-to-date, with the ChiNext Index leading at a 48.09% increase, followed by the Sci-Tech 50 at 47.86% [1] - The communication sector index has the highest weekly gain at 11.55%, while the agriculture, forestry, animal husbandry, and fishery index saw the largest decline at 1.36% [2] - Approximately 59% of respondents reported making profits in the A-share market this week, with 50% of them earning within 10% [6] Group 2 - There is a growing optimism among investors regarding the A-share market, with 79% of respondents believing that the Shanghai Composite Index could reach 4000 points next week [6][8] - The technology sector has seen a significant increase in investor interest, with the proportion of respondents favoring it rising from 32% to 64% [9][10] - The overall risk perception of the A-share market has shifted, with only 16% of respondents considering it high risk, a decrease of 7 percentage points [8]
Bespoke Investment Group's Paul Hickey: Macro backdrop is 'moving in the right direction'
Youtube· 2025-10-24 15:57
Uh, meantime, the major averages all hitting record highs following this morning's cooler than expected inflation report. Our next guest says there could be more gains to come into year end. Let's bring in Bespoke Investment Group co-founder Paul Hickeyi.Uh, Paul, good to catch up with you here. I mean, are we just in don't overthink it mode. Um, you know, we're heading into November.Uh, it seems like, uh, the bond market's kind of calm about the inflation threat and, uh, we're already up, you know, pretty ...

负熵、牛市和趋势投资(策略哲思系列之一):股市中的正反馈机制
ZHESHANG SECURITIES· 2025-10-24 07:57
Core Insights - The report emphasizes the presence of positive feedback mechanisms in the stock market, including herd behavior, incremental capital inflows, and leverage trading as amplifiers of trends [1][2][3] - It suggests maintaining high confidence in the current systematic slow bull market while cautiously avoiding increased volatility in high-positioned sectors [6][4] Understanding Positive Feedback - Positive feedback is characterized as a "negative entropy" accumulation, explaining why prices can temporarily deviate from fundamentals, leading to accelerated trends in both bull and bear markets [2][4] - The mechanisms driving positive feedback include behavioral psychology, trading systems, buyer incentives, and the cyclical behavior of listed companies [3][4] Switching Between Strategies - Investors are encouraged to switch between trend-following and reversal strategies based on market conditions, which can help identify signals of market overheating or cooling [4][5] Investment Recommendations - The current A-share market is in a systematic slow bull phase, with expectations of continued incremental capital inflows and wealth effects [6][28] - It is advised to maintain a balanced style allocation while increasing the decision weight of mean-reversion factors [6][42] Sources of Positive Feedback Mechanisms - Herd behavior and incremental capital inflows are driven by fear of missing out and the anxiety of being left behind, leading to a self-reinforcing cycle in bull markets [28][29] - Leverage trading acts as a trend amplifier, where rising stock prices lead to increased borrowing and further price increases [37][38] Market Dynamics - The report highlights that in bull markets, positive feedback can lead to significant price increases, while in bear markets, it can result in accelerated declines [26][40] - The relationship between leverage and market trends is crucial, as high leverage can exacerbate price movements in both directions [42][43]
X @杀破狼 WolfyXBT
杀破狼 WolfyXBT· 2025-10-22 13:32
Market Trend Analysis - The analysis suggests the Bitcoin bull market has ended and a bear market has begun [1][2] - The peak of the recent bull market was projected around October 6, 2025, with a Bitcoin price of $126,000 [1] Theoretical Framework - The "four-year cycle theory," driven by Bitcoin halving, is considered the most reliable cycle theory in the cryptocurrency space [1] - This theory divides a Bitcoin bull-bear cycle into four phases: "bull start," "halving," "bull end," and "bear market" [1] Cycle Dynamics - "Halving" events precede "bull start" phases, and follow "bull end" phases [1] - "Halving day" occurs during the "mid-section" of the overall bull market [1] - "Bull start" and "bull end" phases have approximately equal durations [1] - A one-year "bear market" follows the "bull end," preceding the next "halving day" and subsequent "bull start" [1]
几次牛市的回顾以及本次的比对
雪球· 2025-10-22 08:08
Group 1 - The article reviews historical bull markets in China and their ending reasons, highlighting the concerns of investors regarding the sustainability of the current bull market [3][4] - The bull market from 1996 to 2000 ended due to high valuations, policy shifts from supporting the market to regulating it, and an oversupply of stocks following state-owned share reductions [3][4] - The 2005-2007 bull market was characterized by simultaneous high economic growth and stock market performance, driven by currency appreciation and a favorable economic environment [3][4] Group 2 - The 2014-2015 bull market was fueled by interest rate cuts, leading to a surge in bank stocks and subsequently other sectors, but ended due to regulatory tightening and external currency pressures [4][5] - The article suggests that the end of the A-share bull market is closely related to policy changes, with a current need for a bull market to stimulate the economy and manage local government debt [6][7] - The relationship between A-shares and the USD exchange rate is emphasized, indicating that a strengthening USD could lead to capital outflows from China, potentially ending the bull market [7]
