交运
Search documents
行业比较周跟踪:A股估值及行业中观景气跟踪周报-20251109
Shenwan Hongyuan Securities· 2025-11-09 14:01
Valuation Summary - The overall valuation of the A-share market as of November 7, 2025, shows the CSI All Share Index (excluding ST stocks) with a PE of 21.5x and a PB of 1.8x, positioned at the 80th and 41st historical percentiles respectively [2][3] - The Shanghai 50 Index has a PE of 11.9x and a PB of 1.3x, at the 64th and 39th historical percentiles [2][3] - The ChiNext Index has a PE of 41.3x and a PB of 5.2x, at the 58th and 60th historical percentiles [2][3] - The valuation of the semiconductor industry is notably high, with a PE of 99.7x, placing it at the 76th historical percentile [7] Industry Valuation Comparison - Industries with PE valuations above the 85th historical percentile include Real Estate, Retail, Chemicals, and IT Services [2][3] - Industries with PB valuations above the 85th historical percentile include Electronics (Semiconductors) and Communications [2][3] - Industries with both PE and PB valuations below the 15th historical percentile include Medical Services and White Goods [2][3] Sector Performance Tracking New Energy - The photovoltaic industry chain saw a price decline, with polysilicon futures down 6.2% and silicon wafer prices down 3.9% [3] - Battery material prices showed mixed trends, with cobalt down 3.2% and lithium hexafluorophosphate up 8.1% [3] Real Estate Chain - The price of rebar fell by 1.7%, while iron ore prices decreased by 3.4% [3] - Cement prices increased slightly by 0.1%, but demand remains weak [3] Consumer Sector - The average price of live pigs dropped by 4.6%, while wholesale pork prices rose by 2.4% [3] - The price index for liquor saw a slight decrease of 0.15% [3] Technology Sector - The semiconductor sales in China grew by 15.0% year-on-year in September 2025, indicating a positive trend in the sector [3] Commodity Sector - Brent crude oil prices fell by 2.1% to $63.7 per barrel, while coal prices increased due to stricter safety inspections and winter storage demand [3]
天风策略:12月美联储预计仍有较大概率降息
Sou Hu Cai Jing· 2025-11-09 10:52
Group 1: Domestic Trade Data - In October, China's exports (in USD) decreased by 1.1% year-on-year, down from an increase of 8.3% in the previous month, while imports rose by 1.0%, down from 7.4% [3][5] - The trade surplus for October was reported at $90.07 billion, slightly down from $90.447 billion in the previous month [3] - The contribution of major trading partners to export growth showed a decline for the EU, ASEAN, Japan, and South Korea, while the US's contribution increased [5] Group 2: Transportation and Industrial Indicators - The subway passenger volume index in first-tier cities showed a slight recovery, reporting 40.61 million trips, up from 40.55 million [12] - The industrial production index increased to 117 from 113, with specific sectors like methanol and tires showing recovery, while soda ash declined [14] Group 3: Domestic Policy Developments - Premier Li Qiang co-hosted the 30th regular meeting of Chinese and Russian Prime Ministers with Russian Prime Minister Mishustin, emphasizing the deepening of Sino-Russian friendship [16][17] - Li Qiang also met with Georgian Prime Minister Kobakhidze to discuss economic cooperation and the Belt and Road Initiative [17] Group 4: International Monetary Policy Outlook - There is a significant probability of the Federal Reserve lowering interest rates by 25 basis points in December 2025, with a 66.9% chance of this occurring [26] - The current economic conditions and geopolitical tensions are influencing the Fed's potential policy decisions [26] Group 5: Industry Investment Recommendations - Investment strategies are suggested to focus on three main areas: breakthroughs in AI technology, economic recovery leading to a "stronger stronger" market trend, and the resurgence of undervalued sectors [28] - The initial phase of the bull market favors high-growth sectors, while later phases may see a shift towards cyclical stocks with better performance as the economic fundamentals improve [28]


2025年三季报深度分析:两非盈利改善,ROE低位反弹
2025-11-03 02:35
Summary of the Conference Call Records Industry Overview - The analysis focuses on the overall performance of the A-share market in Q3 2025, highlighting a significant improvement in net profit growth, particularly in the dual innovation sectors, with the Sci-Tech 50 and ChiNext indices leading in net profit growth rates [1][2]. Key Financial Metrics - The net profit growth rate for the entire A-share market reached 11.55% year-on-year in Q3 2025, a notable increase compared to Q2 [1][2]. - The overall revenue growth for the A-share market was 3.89% year-on-year in Q3, with a cumulative growth of 1.4% for the first three quarters [2]. - The two non-financial sectors (excluding financial and oil & gas industries) showed a revenue growth of 3.5% in Q3, with a cumulative growth of 1.67% [2]. Profitability and Cost Management - The decline in expense ratios significantly contributed to corporate profitability, particularly with financial expenses decreasing by 11% year-on-year [1][6]. - The return on equity (ROE) for the two non-financial sectors slightly rebounded to 6.31% in Q3, although the recovery was weak [1][7]. - The improvement in net profit margins was the main driver for the ROE rebound, while asset turnover remained at a low level [7][10]. Economic Indicators and Their Impact - Macroeconomic indicators showed a rebound in industrial profits due to low base effects in August and September, with improvements in price levels, particularly the Producer Price Index (PPI) [3][11]. - The supply-side reforms are expected to positively influence PPI and related economic indicators, with a potential for PPI to turn positive by mid-2026 [11][12]. Cash Flow Analysis - Overall cash flow in Q3 2025 remained at a low level compared to the past decade, with operating cash flow showing improvement while investment cash flow declined [1][13]. - The operating cash flow for listed companies increased to 7.78% of revenue, up from 6.71% in the previous year, indicating some recovery in profit margins [14]. Sector Performance - The dual innovation sectors (Sci-Tech and ChiNext) showed significant profit improvements, with net profit growth rates of 65.4% and 33.38% respectively [5]. - The TMT (Technology, Media, and Telecommunications) sector maintained high growth, with double-digit net profit growth across various sub-sectors, particularly in semiconductors and optical electronics [23]. - The non-bank financial sector performed well, driven by strong market profitability and significant investment income growth [22]. Consumer Goods Sector - The essential consumer goods sector, particularly the liquor segment, faced challenges with both volume and price declines, impacting even leading companies [19]. - In contrast, the discretionary consumer goods sector saw high growth in segments like sports, automotive services, and cosmetics, benefiting from structural recovery supported by policies [20]. Future Outlook - The economic recovery is expected to accelerate in the latter half of 2025 and into 2026, driven by demand-side policies and improved corporate expectations [18]. - However, there remains uncertainty regarding corporate capital expenditure willingness, as companies have yet to form a strong consensus on future revenue expectations [18]. Conclusion - The overall performance of the A-share market in Q3 2025 indicates a positive trend, with significant improvements in profitability and revenue growth across various sectors. However, challenges remain in consumer goods and the need for sustained economic recovery and corporate investment.
11月金股报告:科技风格有望持续
ZHONGTAI SECURITIES· 2025-10-30 13:05
Group 1 - The core conclusion of the report indicates a solid market win rate, with limited odds space under a "structural bull" scenario, and a continued focus on technology style [6] - The report highlights that the overall index showed a fluctuating trend in October, with the Shanghai Composite Index breaking through 4000 points by the 28th, and a daily average of 50.1% of stocks in the Wande All A index rising, indicating a recovery in profit-making effects [6] - The report notes that the technology style has seen some convergence, primarily due to trade environment disturbances, but is expected to rebound due to anticipated policy support for emerging industries [2][4] Group 2 - The report identifies three key investment strategies: focusing on less crowded segments within technology, globally priced resource products, and manufacturing related to external demand [7] - Specific recommendations for November include the ChiNext 50 ETF, Huari Precision, Hebei Steel Resources, Top Group, Meihu Co., Xiansheng Pharmaceutical, Tiger Medical, China Eastern Airlines, Kante Optical, and China Pacific Insurance, with a rationale provided for each [11][12] - The report emphasizes that the probability of style switching is low, as the industry valuation differentiation indicator has not triggered any signals for a style switch [5]
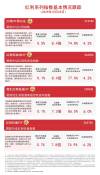
红利指数集体上涨,红利ETF易方达等产品连续多日获资金加仓
Sou Hu Cai Jing· 2025-10-23 05:21
Group 1 - The coal sector experienced a surge, leading to significant gains in transportation and banking sectors, which contributed to an increase in dividend indices, with the CSI Dividend Value Index rising by 0.7% and the CSI Dividend Index by 0.5% as of midday [1] - The Wind data indicates that the E Fund Dividend ETF (515180) has seen a net inflow of over 300 million yuan over the past three days [1] - The composition of high dividend stocks includes those with moderate payout ratios, positive growth in earnings per share, and high dividend yields with low volatility, with banking, transportation, and construction sectors accounting for over 65% [4] Group 2 - The Hang Seng Dividend Low Volatility ETF tracks a selection of 50 stocks within the Hong Kong Stock Connect that have good liquidity, continuous dividends, moderate payout ratios, and low volatility, reflecting high dividend levels and low volatility in the overall performance of these companies, with financial, industrial, and energy sectors making up over 65% [8] - The CSI Dividend Value ETF tracks the CSI Dividend Value Index, which consists of 50 stocks characterized by high dividend yields [10]
股指周报:中美大国博弈仍在反复,关注四中全会是否利多提振-20251020
Zheng Xin Qi Huo· 2025-10-20 05:29
Report Industry Investment Rating No relevant information provided. Core Views - The US government shutdown and Sino-US frictions before the APEC meeting have led to a RISK OFF trading mode, negatively impacting overvalued and crowded AI technology assets. The upcoming 15th Five-Year Plan and the Fourth Plenary Session in China next week may bring unexpected positive effects; otherwise, the market may face further adjustment risks [4]. - Domestically, economic data remains weak, especially in consumption and real estate. Industrial enterprise capacity utilization has declined marginally, indicating slow progress in anti-involution policies and ongoing efforts to reverse deflation. Leading companies in pro-cyclical industries are expected to have better profit prospects [4]. - Domestic liquidity is generally loose, but the central bank has tightened funds in the open market. Passive ETF funds and margin trading funds have continued to attract capital, while industrial capital has increased its reduction, and foreign capital has flowed out significantly recently. Credit impulses have started to decline from their peak, weakening the positive impact of market liquidity [4]. - After a short-term small adjustment, the valuations of various indices remain at relatively high historical levels. The equity-bond risk premiums at home and abroad are at historical lows, and broad-based indices have limited attractiveness to allocation funds, but there are still structural opportunities [4]. - Overall, the limited liquidity in the large-scale market makes it difficult to drive continuous growth. During the window of positive macro-policy implementation, the market will choose a direction, with funds shifting from the aggressive growth style to the cyclical style for year-end valuation switching. It is recommended to adopt a high-selling and low-buying strategy for stock index futures next week, selling short IC and IM index futures on rebounds and buying long IF and IH index futures on sharp declines [4]. Summary by Directory 1. Market Review - **Global Stock Performance**: In the past week, the Dow Jones Index led the gains, while the Hang Seng Tech Index led the losses. The performance order was Dow Jones Index > FTSE Europe > FTSE Emerging Index > Shanghai Stock Exchange 50 > Nikkei 225 > Germany DAX > CSI 300 > CSI 500 > Hang Seng Tech Index [8]. - **Domestic Stock Performance**: The Shanghai Composite Index fell by 1.47%, the Shenzhen Component Index by 4.99%, the ChiNext Index by 5.71%, and the Hang Seng Index by 3.97%, among others [9]. - **Industry Performance**: The banking sector led the gains, while the consumer services sector led the losses [12]. - **Futures Performance**: The basis rates of the four major stock index futures (IH, IF, IC, and IM) changed by 0.47%, 0.63%, 0.9%, and 0.88% respectively, and the delivery discounts of the four major futures converged to par. The inter - period spread rates (between the current month and the next month) of the four major stock index futures changed by - 0.55%, - 0.67%, - 1.05%, and - 0.57% respectively, and the inter - period discounts significantly widened. The inter - period spread rates (between the next quarter and the current month) of the four major stock index futures changed by - 0.66%, - 0.73%, - 1.27%, and - 0.58% respectively, and the forward discounts of each futures contract widened significantly [20]. 2. Fund Flow - **Margin Trading and Stabilization Funds**: Margin trading funds continued to flow in 15.42 billion yuan last week, reaching 2.46 trillion yuan, and the proportion of margin trading balance to the circulating market value of the Shanghai and Shenzhen stock markets increased by 0.08% to 2.63%. The scale of passive stock ETF funds decreased by 70.07 billion yuan to 3638.85 billion yuan last week, due to the market decline [23]. - **Industrial Capital**: In October, the cumulative equity financing was 13.56 billion yuan, with 1 company involved. Among them, IPO financing was 0.79 billion yuan, private placement was 12.77 billion yuan, and convertible bond financing was 3.8 billion yuan. The scale of equity financing decreased significantly. The market value of stock market unlockings last week was 78.4 billion yuan, an increase of 32.6 billion yuan from the previous week. The annualized reduction in October was 248.4 billion yuan, and the scale of reduction continued to increase marginally [26]. 3. Liquidity - **Monetary Injection**: Last week, the central bank's OMO reverse repurchase expired at 1021 billion yuan, with a reverse repurchase injection of 67.3 billion yuan, resulting in a net monetary withdrawal of 347.9 billion yuan. The MLF had a net injection of 300 billion yuan in September, and the overall liquidity supply was neutral to loose but tightened marginally [28]. - **Monetary Demand**: Last week, the net monetary demand from national debt issuance was 16.63 billion yuan, and from local debt issuance was 18.09 billion yuan. The total net monetary demand from the bond market was 557.58 billion yuan. The debt financing demand of local governments and national debt decreased significantly, while that of enterprises increased marginally [31]. - **Fund Price**: DR007, R001, and SHIBOR overnight rates changed by - 1.4bp, 3.8bp, and 0bp respectively to 1.41%, 1.36%, and 1.32%. The issuance rate of inter - bank certificates of deposit rebounded by 8.2bp, and the CD rate of joint - stock banks increased by 4.4bp to 1.67%. The overall fund price fluctuated at a low level and increased marginally [34]. - **Term Structure**: Last week, the yields of 10 - year, 5 - year, and 2 - year national bonds changed by - 1.6bp, - 1.4bp, and - 0.7bp respectively, and the yields of 10 - year, 5 - year, and 2 - year national development bonds changed by - 4.6bp, - 2bp, and 0.3bp respectively. The yield term structure continued to flatten, the long - end yields declined slightly due to stock market adjustments and weak economic data, and the short - end yields were relatively strong due to liquidity tightening. The credit spread between national bonds and national development bonds narrowed at the long - end, and the expectation of broad credit cooled down [38]. - **Sino - US Interest Rate Spread**: As of October 17, the US 10 - year Treasury yield changed by - 3.0bp to 4.02%, the inflation expectation changed by - 3.0bp to 2.27%, and the real interest rate remained unchanged at 1.75%. The Sino - US interest rate spread inversion narrowed by 3.42bp to - 219.43bp, and the offshore RMB appreciated by 0.28% [40]. 4. Macroeconomic Fundamentals - **Real Estate Demand**: As of October 16, the weekly trading area of commercial housing in 30 large - and medium - sized cities was 2.129 million square meters, a seasonal increase of 0.483 million square meters from the previous week, but a 49.7% decrease compared to the same period in 2019. The second - hand housing sales rebounded seasonally, but the overall real estate market still showed a weak peak season. The market sales were supported by rigid demand at a low level, and more incremental policies were awaited to boost the recovery [43]. - **Service Industry Activity**: As of October 17, the average daily subway passenger volume in 28 large - and medium - sized cities decreased by 0.8% year - on - year to 81.44 million person - times, but increased by 24.8% compared to the same period in 2021. The Baidu congestion delay index of 100 cities rebounded slightly from the previous week, and the service industry economic activity tended to grow naturally and stably but cooled down marginally [47]. - **Manufacturing Tracking**: The capacity utilization rate of the manufacturing industry stopped falling and rebounded. The capacity utilization rates of steel mills, asphalt, cement clinker enterprises, and coke enterprises changed by - 0.22%, 1.3%, - 2.87%, and - 0.94% respectively. The average operating rate of the chemical industry chain related to external demand decreased by 0.13% from the previous week. Overall, the internal and external demand of the manufacturing industry cooled down, the capacity utilization rate decreased marginally, and the external demand was under short - term pressure due to the resurgence of Sino - US trade frictions [51]. - **Goods Flow**: The goods flow and passenger flow remained at relatively high levels but declined marginally beyond the seasonal norm, indicating the pressure on the real economy. The transportation volume of highways and railways decreased beyond the seasonal norm, indicating a cooling of exports [56]. - **Imports and Exports**: In terms of exports, the resurgence of Sino - US trade frictions, the approaching expiration of the 90 - day exemption, and the end of the rush to export under tariff disturbances will increase the export pressure marginally in the future [58]. - **Overseas Situation**: The US economic data is strong. Although the US government shutdown has affected the release of CPI and non - farm payroll reports, the market still expects the Fed to cut interest rates twice in the remaining part of 2025, with a total reduction of about 50bp. The probability of an interest rate cut in October is as high as 99%, and the probability in December has risen to 94%. The expected end - of - year interest rate is between 3.5% - 3.75% [61]. 5. Other Analyses - **Valuation**: The equity - bond risk premium was 2.68%, an increase of 0.1% from the previous week, at the 48.3% quantile, below the central level. The foreign capital risk premium index was 3.62%, a rebound of 0.08% from the previous week, at the 18.5% quantile, indicating a low level of attractiveness to foreign capital. The valuations of the Shanghai Stock Exchange 50, CSI 300, CSI 500, and CSI 1000 indices were at the 90.1%, 83.9%, 93.6%, and 79.7% quantiles respectively in the past five years, at relatively high levels. The quantiles changed by 3.3%, - 3.1%, - 5%, and - 4.1% respectively from the previous week, indicating that the attractiveness of the cyclical style decreased marginally, while that of the growth style index increased marginally [64][69]. - **Quantitative Diagnosis**: According to the seasonal pattern analysis, the stock market in October is in a period of seasonal oscillatory rise and structural differentiation, with the cyclical style dominant and the growth style generally oscillating at a high level. The stock market in October generally has a good profit - making effect, and the style is easy to switch. Considering the high valuation of the growth style and the relatively weak real economy, but with positive macro - policy expectations in October, it is recommended to buy long stock index futures on sharp declines this week and bet on the oversold rebound opportunities of IC and IM [72].
行业比较周跟踪:A股估值及行业中观景气跟踪周报-20251019
Shenwan Hongyuan Securities· 2025-10-19 12:18
Investment Rating - The report does not explicitly provide an overall investment rating for the industry but highlights various sectors with their respective valuation metrics [1][2]. Core Insights - The report tracks A-share valuations and industry sentiment, indicating that the overall market is experiencing varied valuation levels across different indices and sectors [1][2]. - Key sectors such as real estate, steel, and IT services are noted for their high PE ratios, suggesting potential overvaluation, while white goods are highlighted as undervalued [1][2]. Valuation Comparisons - The report provides a detailed comparison of PE and PB ratios across major indices, with the CSI All Share (excluding ST) PE at 21.3x and PB at 1.8x, indicating historical percentiles of 79% and 39% respectively [1][4][5]. - The report identifies industries with PE ratios above the historical 85th percentile, including real estate, steel, and IT services, while white goods are noted for being below the 15th percentile [1][7]. Industry Sentiment Tracking - **New Energy**: The report notes a slight decline in downstream prices for photovoltaic products, while upstream polysilicon prices have increased by 6.3%. The demand for lithium materials remains strong due to stable orders in the traditional peak season [1][2]. - **Real Estate Chain**: Steel prices have decreased, with rebar prices down by 1.7% and iron ore prices down by 1.4%. Cement prices are also under pressure due to insufficient demand [2]. - **Consumer Goods**: Pork prices have seen a slight decline, while liquor prices have stabilized. Agricultural products like corn and wheat have mixed price movements [2]. - **Midstream Manufacturing**: Excavator sales have increased by 25.4% year-on-year, driven by infrastructure projects and equipment upgrades. Heavy truck sales have surged by 82.9% year-on-year, reflecting strong demand [2]. - **Cyclical Industries**: The report highlights fluctuations in metal prices due to geopolitical tensions and economic concerns, with precious metals seeing significant price increases [2]. Key Industry Valuations - The report lists specific industry valuations, with real estate at a PE of 120.0 and a PB of 16.6, indicating a high valuation relative to historical norms. In contrast, the white goods sector has a PE of 10.4, suggesting it is undervalued [1][7].
9月外贸数据解读:贸易摩擦再起,如何影响出口?
CAITONG SECURITIES· 2025-10-13 12:38
Export Performance - In September, China's export year-on-year growth rate recorded 8.3%, an increase of 3.9 percentage points from the previous month, but the two-year average growth rate has declined[4] - Exports to emerging markets such as Latin America and Africa improved significantly, while direct exports to the U.S. rebounded[4] - Consumer electronics and general machinery saw notable increases in export volumes[4] Import Performance - China's import year-on-year growth rate in September was 7.4%, up 6.1 percentage points from August, significantly higher than the average of the past five years[12] - The increase in imports was primarily driven by rising demand for production raw materials and energy, with notable recovery in imports from resource countries and the EU[12] - Among major trading partners, imports from the EU rose by 9.5%, while imports from the U.S. decreased by 16.1%[12] Trade Balance - The trade surplus in September was $90.45 billion, a slight contraction from the previous month, but net exports continue to support the economy[16] - The outlook for exports in the fourth quarter is stable but expected to decline slightly due to elevated export bases and a weakening U.S. economy[16] Sector Insights - Significant improvements were noted in mobile phones and general machinery exports, with mobile phone exports increasing by over 15 percentage points year-on-year[9] - In the transportation sector, shipbuilding saw a growth rate of 43%, while automotive exports declined by 10.8%[9] Risks - Risks include potential underperformance of domestic economic recovery, unexpected declines in demand from developed countries, and changes in import-export policies[18][20]
极致行情后风格分化有望收敛,价值ETF投资价值备受关注
Sou Hu Cai Jing· 2025-10-13 09:15
Group 1 - Since May, market risk appetite has significantly increased, with domestic computing power and technology sectors leading the rally, while industries like home appliances, banking, and transportation lagged due to a lack of popular narratives [1] - The absolute value of the return differentiation between growth and value styles has exceeded the historical 90th percentile level over the past three months, indicating an extreme level of divergence [1] - Historical context shows that the last time growth and value styles reached a similar extreme was during the 924 market, where growth significantly outperformed value, but value began to gain momentum from November 2024 [2] Group 2 - As of May this year, the Guozheng Value 100 Index rose by 6.59%, while the Growth 100 Index fell by 1.30%, demonstrating the convergence of style returns [2] - Current A-share market valuations, measured by PE, PB, and total market value/GDP, indicate that while valuations are above historical averages, there is still room to reach historical peaks [2][3] - The Guozheng Value 100 Index, tracked by value ETFs, employs a "low valuation + high dividend + high free cash flow" screening criterion to identify undervalued quality companies [3] Group 3 - The historical performance of the Guozheng Value 100 Index shows an annualized return of 17.3% since 2013, with a risk-return ratio of 0.81, outperforming the annualized return of the CSI Dividend Index at 11.1% and the CSI 300 Index at 7.4% [3]

10月金股报告:市场预计维持震荡,科技关注性价比
ZHONGTAI SECURITIES· 2025-09-26 13:12
Group 1: Market Overview - The macroeconomic environment remains supportive with expectations of further easing from the Federal Reserve, which has already lowered rates by 25 basis points in September, with projections for additional cuts by the end of the year [2] - A-shares are experiencing a high level of trading activity, with average daily turnover exceeding 2.45 trillion yuan in September, up from 2.31 trillion yuan in August, indicating strong market liquidity [2] - The technology sector continues to show strength, with the Wande Technology Index accounting for 40.8% of total A-share trading volume, reflecting ongoing liquidity inflows into this sector [2] Group 2: Sector Analysis - The technology sector is characterized by a clear differentiation between high and low performers, with previous leaders like optical modules and communication equipment seeing lower gains in September, while semiconductor materials and energy storage stocks have shown significant recovery [2][3] - Cyclical and dividend-paying stocks remain weak due to poor economic data, with various sectors underperforming compared to technology [3] - The current risk premium for A-shares is low, with the risk premium for the CSI 300 index at 5.19%, close to historical lows, suggesting limited downside potential [3] Group 3: Investment Strategy - The report recommends focusing on technology stocks with a strong price-performance ratio, particularly those that have lagged behind in previous rallies, to enhance potential returns [5] - There is an emphasis on upstream materials related to energy storage and semiconductor industries, such as lithium and cobalt, which are expected to benefit from ongoing demand growth in electric vehicles and semiconductor manufacturing [5] - The October stock selection includes a diverse range of sectors, highlighting companies in innovative pharmaceuticals, electronics, automotive, and communications, indicating a strategic approach to capitalize on sectoral strengths [10][11]